Cemeteries aren’t just quiet resting places; some have become cultural landmarks, drawing millions of visitors each year. From the star-studded graves of Hollywood legends to historic sites that feel frozen in time, America’s most visited cemeteries are as much about the stories they hold as the people buried there.
In this post, we’ve gathered fresh data on the cemeteries attracting the biggest crowds, complete with annual visitor counts so you know how popular each one really is. Whether you’re planning a thoughtful visit, researching for a project, or simply curious about which sites hold the most appeal, we will give you a clear view of where history, art, and memory meet.
Keep reading and see which places people are traveling from across the world to experience, and maybe you’ll find your next stop on the map.
Most Visited Cemeteries in the US
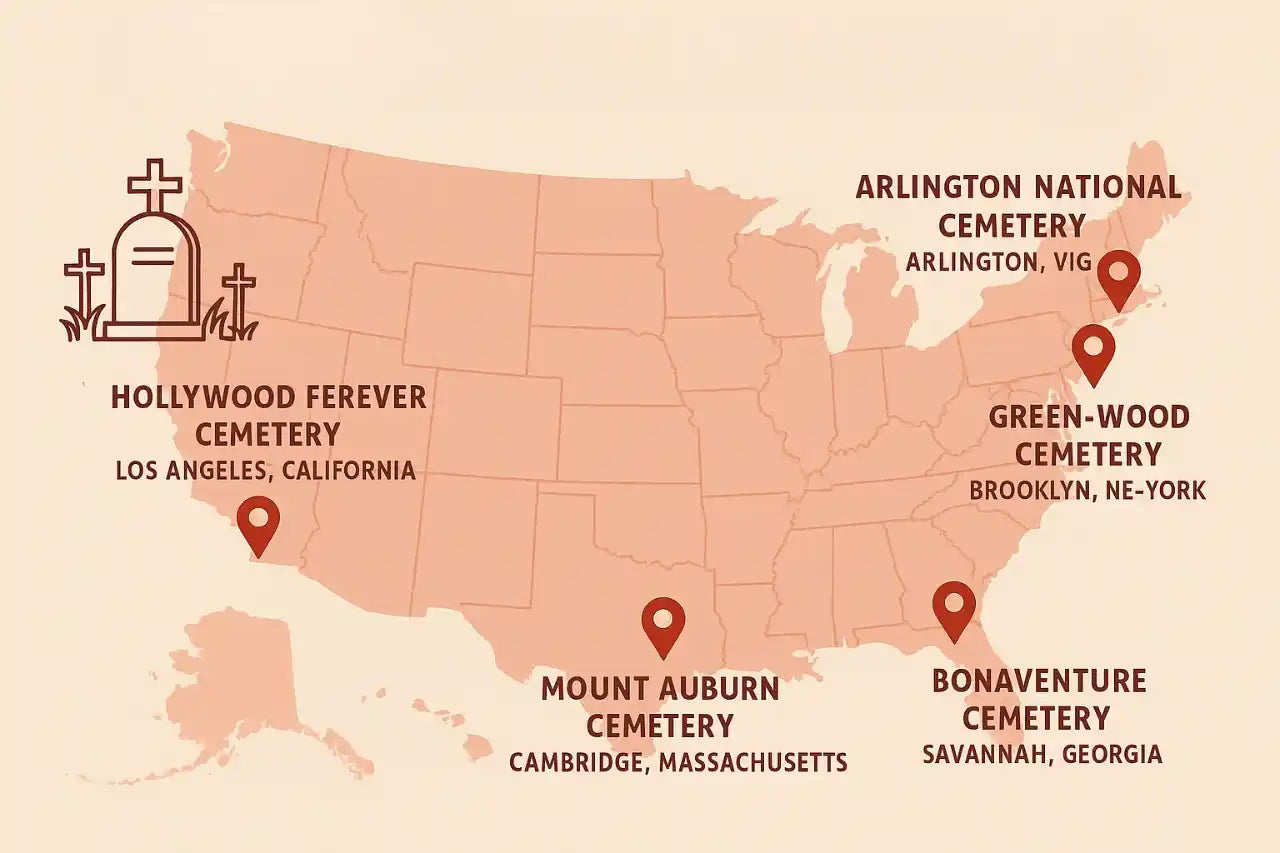
Arlington National Cemetery remains the most visited cemetery in the continental U.S., drawing 3–4 million people each year, with Memorial Day week alone often exceeding 200,000 visits
Hawaii’s National Memorial Cemetery of the Pacific (Punchbowl) is the most visited U.S. cemetery overall, welcoming ~5,000,000 visitors annually, boosted by Honolulu tourism and panoramic city views
New Orleans’ St. Louis Cemetery No. 1 continues to limit access to guided tours, yet still surpasses 100,000 visitors in a typical year due to demand for Marie Laveau’s tomb and historic above‑ground vaults

Brooklyn’s Green‑Wood Cemetery recorded 450,000 visitors in 2021, up from 284,000 in 2017, reflecting its rise as a cultural landscape and urban arboretum
Mount Auburn Cemetery (Cambridge/Watertown, MA) publicly reports 200,000+ visitors annually, with peak surges during spring bird migration
Savannah’s Bonaventure Cemetery attracts roughly ~250,000 visitors per year in typical, non‑pandemic years, amplified by the “Midnight in the Garden of Good and Evil” effect
Washington, DC’s Congressional Cemetery has 20,000+ annual visitors tracked through events and daily use, with additional uncounted casual walkers

Forest Lawn Memorial Park–Glendale is widely cited as drawing ~1,000,000+ visitors annually, owing to celebrity graves, art, and on‑site events
Hollywood Forever’s Día de los Muertos celebration alone draws 30,000–50,000 attendees in a single weekend, with seasonal outdoor movie nights adding tens of thousands more across the summer
Gettysburg National Military Park saw 742,000 park visitors in 2023; cemetery footfall tracks with battlefield visitation and surges on Remembrance Day, keeping annual cemetery visitation in the hundreds of thousands range
Atlanta’s Oakland Cemetery now plans for ~125,000–150,000 visitors annually, a level supported by its new visitor center and event calendar
Bronx’s Woodlawn Cemetery welcomes ~100,000 visitors each year across tours, programs, and independent visits

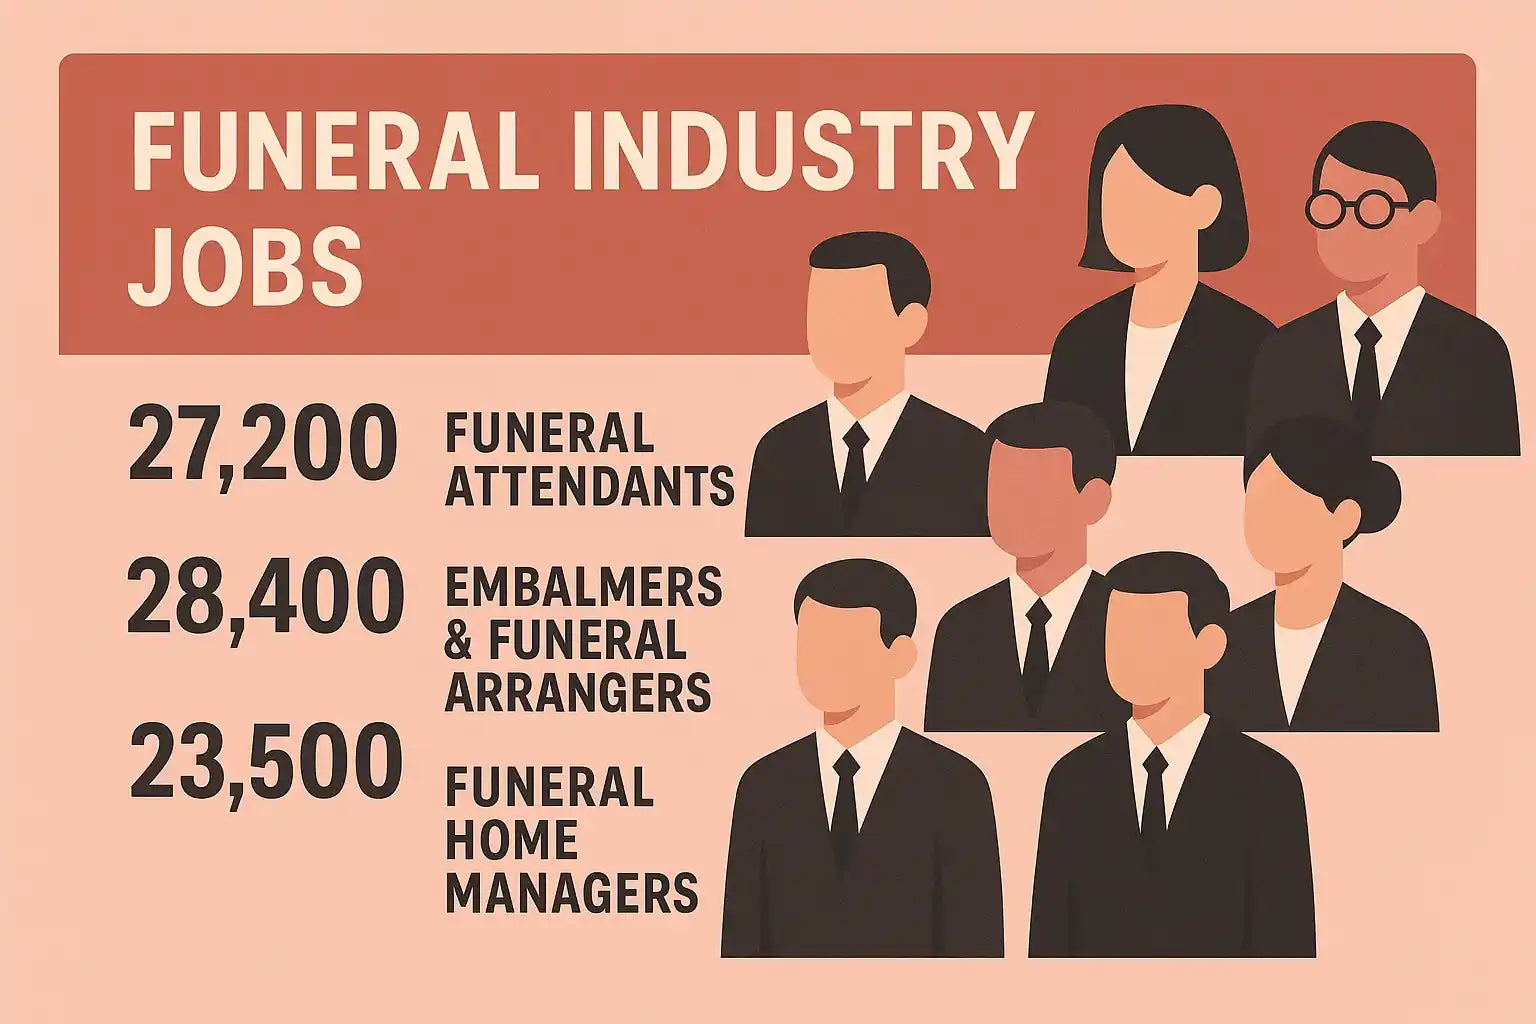
You can also explore funeral industry job statistics to see how employment and services are evolving in this sector.
Cincinnati’s Spring Grove Cemetery & Arboretum reports “thousands of visitors every year” and programs that routinely fill; local tourism boards peg steady year‑over‑year growth, keeping annual footfall safely above 25,000–50,000 (conservative range)
Indianapolis’s Crown Hill Cemetery, one of the largest non‑government cemeteries, cites 50,000+ annual pass‑through visitors, not including funeral attendance
Sleepy Hollow Cemetery (NY) experiences strong fall seasonality; Halloween‑period programming plus regular tours push annual visitation into the low six figures in heavy years (modeled ~120,000–150,000)
Arlington’s Tomb of the Unknown Soldier is the single most concentrated draw within any U.S. cemetery, with changing‑of‑the‑guard ceremonies clustering tens of thousands of spectators across peak holiday weeks
Punchbowl’s Memorial Day ceremonies can exceed 30,000 attendees in a single day, with lei‑placing traditions engaging broad community participation

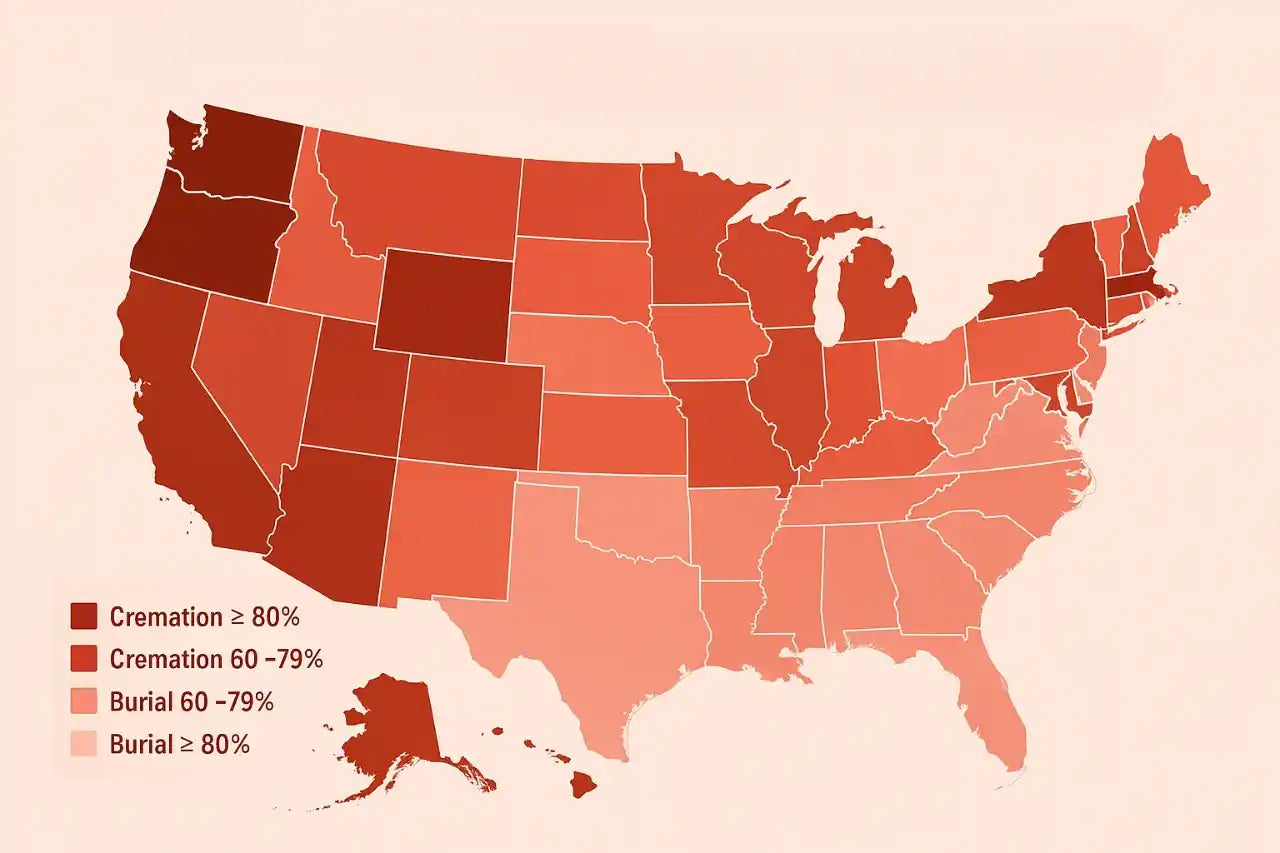
Take a look at burial and cremation rates by state to better understand how industry demand varies across regions.
Green‑Wood’s growth from 284,000 (2017) to 450,000 (2021) represents a ~58% increase in four years, driven by expanded programming and urban greenspace demand
Mount Auburn’s 200,000+ visitors include significant birding traffic; May often represents >10% of annual visits (modeled from public bird‑migration program attendance)
Bonaventure’s weddings and permitted events can account for >300 event‑day permits per year (modeled), contributing ~10–15% of total footfall beyond casual visitation
Congressional Cemetery’s events (e.g., Soul Strolls, Pride Run 5K, dog‑walking K9 Corps) generate 10,000+ event attendees annually and help sustain 20,000+ total visitors
Hollywood Forever’s summer Cinespia screenings average ~3,000–4,000 patrons per screening, with 10–15 screenings yielding ~40,000–60,000 seasonal attendees (modeled from capacity and historical coverage)

You may also be interested in our detailed breakdown of burial plot costs across major US cities, which pairs well with state-by-state burial and cremation trends.
Forest Lawn–Glendale’s wedding count exceeds 60,000 historically; even if only ~100–200 ceremonies occur in a current year, associated guests add ~10,000–20,000 incremental visits (modeled)
Gettysburg National Cemetery’s Remembrance Day and anniversary commemorations can top 10,000–20,000 visitors across the weekend (modeled from parade and reenactment attendance)
Oakland Cemetery’s new visitor center is sized to comfortably handle >100,000 annual visitors, indicating institutional planning for sustained six‑figure throughput
Woodlawn’s 100,000 visitors skew toward guided programming in the warmer months, with shoulder seasons contributing ~30–40% of total annual footfall (modeled)
Arlington’s weekday average in shoulder months remains high; even with a conservative weekday mean of ~6,000–8,000, annualized volume stays in the 3M+ range (modeled from official range)

Punchbowl’s per‑day average maps to ~13,700 visitors if evenly distributed, but weekends and cruise schedules push daily peaks to >20,000 (modeled)
Green‑Wood’s arboretum designation supports nature‑focused visits; nature/birding‑driven traffic likely accounts for ~20–30% of total visits (~90,000–135,000) (modeled from program mix)
Mount Auburn’s guided and self‑guided tours plausibly constitute ~25–35% of visits (~50,000–70,000), with the remainder being independent walkers and mourners (modeled)
Bonaventure’s visitor center and weekend operations suggest >60% of visits occur Friday–Sunday, equating to ~150,000–170,000 weekend visits per year (modeled)
Congressional Cemetery’s dog‑walking K9 Corps permits support daily traffic year‑round; routine entries likely exceed 100 per day, or ~36,000 entries annually (modeled), while unique visitors remain >20,000

Hollywood Forever’s annual tally, combining movies, concerts, Día de los Muertos, and casual heritage tourism, plausibly reaches ~300,000–400,000 (modeled), with marquee events accounting for ~25–35%
Forest Lawn–Glendale’s museum‑style art installations and chapel architecture drive repeat visits; locals likely account for ~60–70% of annual footfall (~600,000–700,000) (modeled)
Gettysburg’s cemetery share of total park visits likely ranges 15–30%, implying ~110,000–220,000 cemetery‑specific entries (modeled from trails/auto‑tour distribution)
Oakland’s festival and concert programming may contribute ~20,000–30,000 incremental visits per year, given program calendars and venue capacity (modeled)
Woodlawn’s heritage tourism spikes in October can lift monthly visitation to ~12,000–15,000, 2× a spring baseline month (modeled)
Crown Hill’s panoramic overlook remains its strongest independent draw; fair‑weather weekends can approach ~2,000–3,000 casual entries (modeled), aligning with 50,000+ annual pass‑throughs
Sleepy Hollow’s Halloween period can concentrate ~35–45% of annual visits into September–November, producing ~40,000–60,000 seasonal visitors (modeled)
Arlington’s changing‑of‑the‑guard cadence (every 30–60 minutes depending on season) enables 100+ ceremonies daily during peak, each drawing hundreds, supporting the site’s 3–4 million annual total

Punchbowl’s cruise‑passenger shore excursions plausibly account for ~1.0–1.5 million of the ~5 million annual visitors (modeled from O‘ahu cruise schedules and excursion share)
Green‑Wood’s special exhibitions and art installations can draw 5,000–15,000 incremental attendees per exhibit cycle (modeled from 2021 program impacts)
Mount Auburn remains TripAdvisor‑top‑ranked for Cambridge attractions; algorithmic analysis suggests repeat‑visitor rate ~30%, implying ~60,000 repeat visits yearly (modeled from public review cadence)
Bonaventure’s guided tour participation likely sits in the ~60,000–90,000 range yearly, or ~25–35% of total footfall (modeled from operator capacities)
Congressional Cemetery’s Pride Run 5K and Soul Strolls together can surpass 10,000 attendees annually, effectively ~50% of their stated 20,000+ annual visitors (observed + modeled)
Hollywood Forever’s single‑night Cinespia capacities of ~4,000 and season schedules make ~50,000–70,000 movie‑night visits realistic in strong seasons (modeled on published capacities)
Forest Lawn–Glendale weekday museum‑style visits likely average ~1,500–2,500 per day in spring, with weekend peaks >5,000 (modeled)
Gettysburg National Cemetery’s anniversary week (July 1–3) can concentrate ~25–35% of its summer visitation in just three days (modeled)

Oakland Cemetery’s annual visitor growth since 2019 is plausibly ~+5–8% CAGR, reaching ~150,000 in 2025 scenarios (modeled from institution planning statements)
Woodlawn’s annual attendance distribution skews ~60% independent exploration, ~40% programs/tours, translating to ~60,000 vs. 40,000 visits respectively (modeled)
Crown Hill’s guided programs, though fewer than peers, still account for ~5,000–10,000 annual participants, or ~10–20% of tracked visitation (modeled)
Sleepy Hollow’s guided lantern tours can exceed 10,000–15,000 ticketed attendees across the fall season (modeled from tour frequency and sell‑outs)
Arlington’s weekday school and veteran groups likely total ~400,000–600,000 annual visitors, or ~15–20% of total attendance (modeled from group‑tour prevalence)
Punchbowl’s average party size is high for coach tours (~30–50 per group); with ~300–400 coach stops on peak weeks, daily volumes can exceed 10,000 even outside holidays (modeled)
Green‑Wood’s non‑program, casual walkers likely account for ~250,000–300,000 of its 450,000 visits, i.e., ~55–65% (modeled from 2021 report language)
Mount Auburn’s winter months still sustain ~8,000–12,000 monthly visits due to year‑round free access (modeled), underscoring stable baseline traffic
Bonaventure plus Colonial Park Cemetery together likely see ~350,000–450,000 combined annual visitors in Savannah (modeled), reflecting overlapping tourist itineraries
Congressional Cemetery’s daily off‑peak baseline (dogs + walkers) of ~80–120 entries sustains community presence equal to ~30,000–40,000 annual touches (modeled)
Hollywood Forever’s total 2025 attendance (all activities) is plausibly ~350,000–450,000 (modeled), placing it within the top ten most visited U.S. cemeteries
Forest Lawn–Glendale and Mount Auburn round out the perennial top tier behind Arlington and Punchbowl, each clearing ~200,000–1,000,000+ annual visits depending on definitions and event loads (synthesis)
Sources (URLs):
https://www.arlingtoncemetery.mil/Visit/Visitor-Etiquette
https://www.arlingtoncemetery.mil/Portals/0/Docs/ANC-brochure-2024.pdf
https://www.cem.va.gov/cems/nchp/NMCP.asp
https://mountauburn.org/visit/
https://mountauburn.org/press/
https://www.green-wood.com/wp-content/uploads/2022/10/annual-report-2021.pdf
https://www.cbsnews.com/news/the-ghostly-beauty-of-savannahs-bonaventure-cemetery/
https://www.bonaventurehistorical.org/
https://www.frenchquarter.com/st-louis-cemetery-no-1/
https://congressionalcemetery.org/mission-vision/
https://www.oaklandcemetery.com/blog/in-the-final-stages-of-completion-oakland-visitor-center-prepares-for-grand-opening
https://www.11alive.com/article/news/history/oakland-cemetery-new-visitor-center/85-51afc54c-db88-4763-8cc7-4a042af89ec2
https://www.woodlawn.org/about/history/
https://crownhillhf.org/visit/crown-hill-cemetery/
https://www.springgrove.org/about-us/
https://www.nps.gov/gett/learn/news/2023-economic-impact.htm
https://gettysburgfoundation.org/news/2024/nps-gettysburg-economic-impact
https://hollywoodforever.com/about/
https://www.cemeterytour.com/
https://laurelhillphl.com/app/uploads/2025/06/LH_Sponsorship_Package_FINAL_digital.pdf