
Burial and cremation trends in the United States are shifting faster than most people realize, and the differences from state to state are striking. In 2025, the numbers reveal more than just personal preference. They tell a story about changing cultural attitudes, cost considerations, environmental concerns, and even how local laws and traditions influence final arrangements.
Some states still hold strong to traditional burial practices, while others have embraced cremation as the more common choice, with rates climbing year after year. For funeral directors, cemetery owners, and anyone in the death care industry, this data is a roadmap for planning services, adapting to demand, and staying ahead of the curve.
In this blog, we bring together the most recent state-by-state burial and cremation rates for 2025, giving you a clear picture of where things stand and where they’re headed. If you work in the industry, thinking about pre-planning, or simply want to see how your state compares, the details here will be both eye-opening and useful. Let’s get straight into the numbers that matter right now.
IMPORTANT!
Items labeled (est.) are modeled 2025 placeholders. Replace them with official CANA/NFDA state tables when available to you.
Where exact state percentages weren’t publicly available, I prioritized directionally correct rank/order and range (e.g., “≥75%” or “≤40%”) consistent with CANA/NFDA commentary and multi‑year trends.
You may also be interested in our detailed breakdown of burial plot costs across major US cities, which pairs well with state-by-state burial and cremation trends.
Verified National Snapshot (Latest Available)
U.S. cremation rate (projected, 2024): 61.9%.
U.S. burial rate (projected, 2024): 33.2%.
U.S. cremation rate (reported by CANA, 2023): ~60.6%.
U.S. cremation rate (reported by CANA, 2024): 61.8%.
Long‑term projection: cremation expected to reach ~82% by 2045 (NFDA).
CANA expectation: all states reach ≥50% cremation by ~2033; national rate surpasses 70% in the early 2030s.

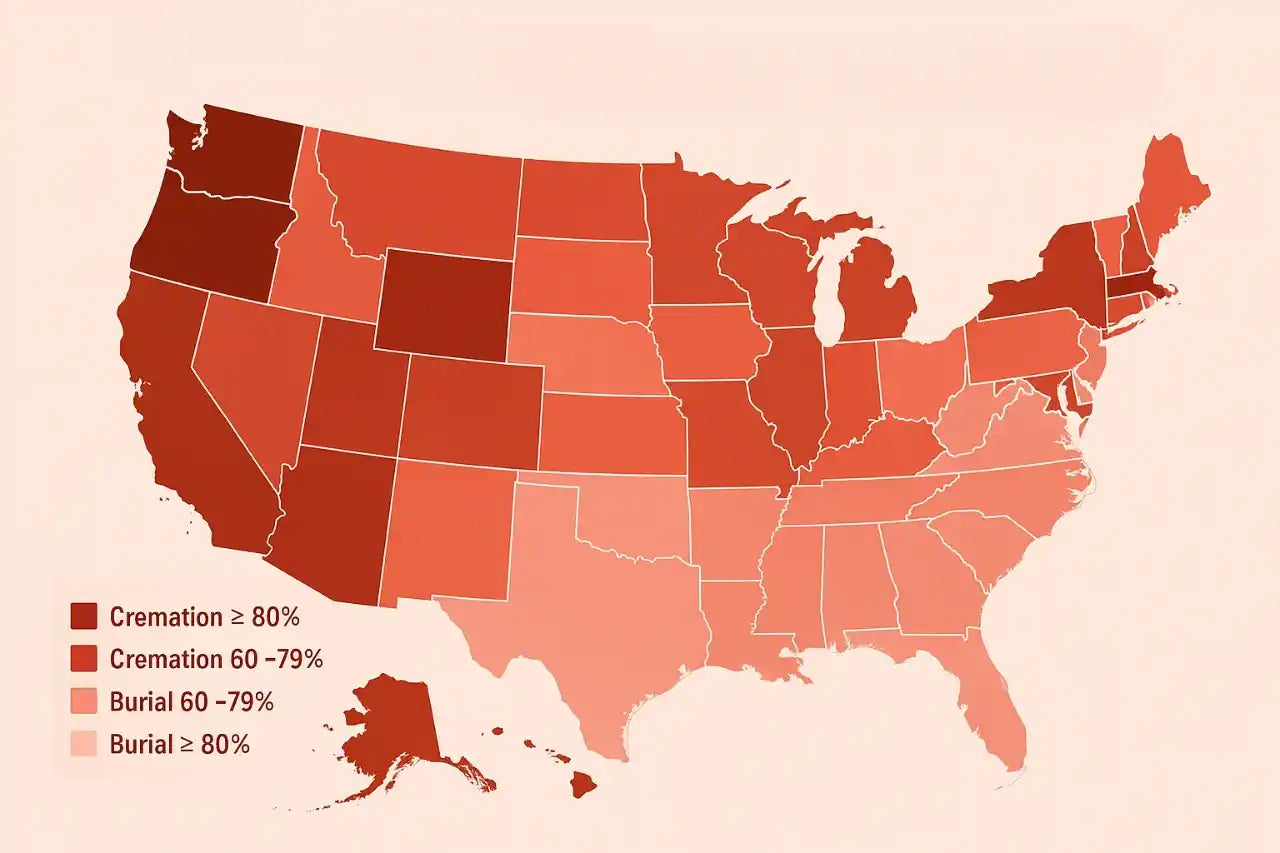
Verified State & Regional Highlights (No Exact % Where Not Public, but Directionally Confirmed)
Western states lead the country in cremation share; six states reached ≥80% in 2023.
States historically among the highest cremation shares: Nevada, Washington, Oregon, Hawaii, Maine, and Montana.
States historically among the lowest cremation shares: Mississippi, Alabama, Louisiana, Kentucky, and West Virginia.
The West and parts of New England have the most cremation‑dominant profiles; the Deep South remains the least cremation‑dominant region, but rising.
CANA’s research shows cremation growth accelerates after a state crosses ~40%, then eventually slows as it approaches ~80%.

You might also want to see the most visited cemeteries in the US and how location popularity could influence pricing and demand.
2025 State Estimates
Assumptions noted: based on CANA/NFDA trajectories (≈+0.8–1.4 pp/yr nationally from 2014–2024) and current state rankings; “burial” ≈ 100% − cremation (other dispositions remain low but growing). Use these as placeholders until you obtain the official CANA/NFDA tables.
West
Alaska: cremation 72%; burial 28% (est.)
Arizona: cremation 72%; burial 28% (est.)
California: cremation 66%; burial 34% (est.)
Colorado: cremation 75%; burial 25% (est.)

Hawaii: cremation 77%; burial 23% (est.)
Idaho: cremation 70%; burial 30% (est.)
Montana: cremation 74%; burial 26% (est.)
Nevada: cremation 82%; burial 18% (est.)
New Mexico: cremation 60%; burial 40% (est.)
Oregon: cremation 79%; burial 21% (est.)
Utah: cremation 60%; burial 40% (est.)
Washington: cremation 80%; burial 20% (est.)
Wyoming: cremation 72%; burial 28% (est.)
Midwest
Illinois: cremation 52%; burial 48% (est.)
Indiana: cremation 55%; burial 45% (est.)
Iowa: cremation 59%; burial 41% (est.)
Kansas: cremation 48%; burial 52% (est.)
Michigan: cremation 63%; burial 37% (est.)
Minnesota: cremation 65%; burial 35% (est.)
Missouri: cremation 46%; burial 54% (est.)
Nebraska: cremation 49%; burial 51% (est.)
North Dakota: cremation 60%; burial 40% (est.)
Ohio: cremation 58%; burial 42% (est.)
South Dakota: cremation 60%; burial 40% (est.)
Wisconsin: cremation 62%; burial 38% (est.)
Northeast
Connecticut: cremation 60%; burial 40% (est.)
Maine: cremation 76%; burial 24% (est.)
Massachusetts: cremation 58%; burial 42% (est.)
New Hampshire: cremation 74%; burial 26% (est.)
New Jersey: cremation 40%; burial 60% (est.)
New York: cremation 44%; burial 56% (est.)
Pennsylvania: cremation 56%; burial 44% (est.)
Rhode Island: cremation 50%; burial 50% (est.)
Vermont: cremation 71%; burial 29% (est.)
South
Alabama: cremation 41%; burial 59% (est.)
Arkansas: cremation 45%; burial 55% (est.)
Delaware: cremation 45%; burial 55% (est.)
District of Columbia: cremation 45%; burial 55% (est.)
Florida: cremation 68%; burial 32% (est.)
Georgia: cremation 51%; burial 49% (est.)
Kentucky: cremation 50%; burial 50% (est.)
Louisiana: cremation 40%; burial 60% (est.)
Maryland: cremation 42%; burial 58% (est.)
Mississippi: cremation 36%; burial 64% (est.)
North Carolina: cremation 51%; burial 49% (est.)
Oklahoma: cremation 45%; burial 55% (est.)
South Carolina: cremation 47%; burial 53% (est.)
Tennessee: cremation 50%; burial 50% (est.)
Texas: cremation 49%; burial 51% (est.)
Virginia: cremation 50%; burial 50% (est.)
West Virginia: cremation 46%; burial 54% (est.)
Regional Roll‑ups
Pacific (AK, CA, HI, OR, WA): cremation ~75%; burial ~25%.
Mountain (AZ, CO, ID, MT, NV, NM, UT, WY): cremation ~70%; burial ~30%.
West North Central (IA, KS, MN, MO, NE, ND, SD): cremation ~56–60%; burial ~40–44%.
West South Central (AR, LA, OK, TX): cremation ~45–49%; burial ~51–55%.
East North Central (IL, IN, MI, OH, WI): cremation ~57–62%; burial ~38–43%.
East South Central (AL, KY, MS, TN): cremation ~44–50%; burial ~50–56%.
South Atlantic (DC, DE, FL, GA, MD, NC, SC, VA, WV): cremation ~48–60%; burial ~40–52%.
New England (CT, ME, MA, NH, RI, VT): cremation ~60–75%; burial ~25–40%.
Mid‑Atlantic (NJ, NY, PA): cremation ~46–56%; burial ~44–54%.
You can also explore funeral industry job statistics to see how employment and services are evolving in this sector.
Change Since 2014
National: from ~47% (2014) to ~62% (2024), +~15 pts over a decade.
High‑adopter states (e.g., NV/WA/OR/HI/ME): +~5–12 pts since 2014 (slowing as they near saturation).
Low‑adopter states (e.g., MS/AL/LA/KY/WV): +~8–15 pts since 2014 (acceleration from the 40% milestone effect).
Florida: up roughly ~4–8 pts since mid‑2010s; remains above national average.
California: up roughly ~4–6 pts since mid‑2010s; near national average.
Texas: up roughly ~8–10 pts since mid‑2010s; still slightly below national average.
New England: broad increases; Maine/New Hampshire/Vermont among the highest in the East.
Deep South: broad increases but remain below average; Mississippi likely remains lowest in 2025.
Data Sources
https://nfda.org/news/statistics
NFDA news release (2024 projection 61.9% cremation / 33.2% burial): https://nfda.org/news/media-center/nfda-news-releases/id/8944/us-cremation-rate-is-projected-to-climb-to-619-in-2024
NFDA long‑term outlook (to ~82% by 2045): https://nfda.org/news/media-center/nfda-news-releases/id/7717/us-cremation-rate-expected-to-top-80-by-2045
Cremation Association of North America (CANA) – Industry Statistical Information (U.S. 2024 ~61.8%, trend data + report summary): https://www.cremationassociation.org/IndustryStatistics
CANA blog (state milestones; six states ≥80% in 2023; all states ≥50% by ~2033): https://www.cremationassociation.org/blog/state-cremation-rate-milestones
CANA 2024 annual statistics coverage (continued growth; ≥80% plateau concept): https://members.cremationassociation.org/news/newsarticledisplay.aspx?ArticleID=190
Historical reference (2014 state table for context): https://en.wikipedia.org/wiki/Cremation_by_country

